
Fresh produce & floral support 2.2 million total jobs, $120.1 billion in labor income.

IFPA is the largest industry association representing the interests, individuals, and organizations across the global supply chain of all sizes and specialties. The organization is positioned to serve as a resource and partner for the media, policymakers, and change leaders who are invested in the solutions the industry has the power to provide.
Forward
IFPA commissioned Kleinhenz & Associates to provide a comprehensive overview of the economic and employment impact represented by the entire fresh produce and floral supply chains. The fresh produce and floral industries encompass a diverse range of activities and products that extends beyond farmers and producers to include employment in marketing and distribution, retail establishments, and food services. Utilizing government and industry data, and paired with IMPLAN, a most-advanced economic impact modeling application, this report demonstrates that an estimated 2.2 million total jobs are supported by the fresh produce and floral industries, which includes the indirect and induced impacts of the direct employment.
After consultation with advisory economists at IMPLAN, as well as input from industry experts, it was determined that using the 2019 IMPLAN data and model would be best to represent the industry. In 2019, the industry was operating at a normal, pre-COVID pace with typical buying and selling channels and a direct employment level estimated to be 1,166,616 jobs.
While the most current IMPLAN data available for the entire economy is from 2020, taking measure of the industry’s economic footprint in that timeframe would yield an abnormal result and not represent strengths found in a normal economy. The industry was reeling from the effects of the COVID pandemic and its employment dropped 3.6 percent to 1,126,277 jobs. Like other segments of the economy, normal industry supply chains, as well as distribution channels, were severely disrupted. Supply channels for restaurants found virtually no markets, while supply channels for groceries were overwhelmed. Trucking and container transportation were at a premium which affected the industry along with the entire economy.
For the first six months of 2022, the industry demonstrated signs of recovery. Employment in the first half of 2022 is nearly identical to employment in the first half of 2019, differing by less than 1 percent. This difference from a modeling perspective indicates that the economic estimates using the 2019 model data may be largely reflective of the 2022 industry economy. By comparison, employment levels for the first six months of 2020 and 2021 are 2.9 and 3.2 percent below 2019 employment levels, respectively.
The estimated economic impact of the industry on the U.S. economy is represented in 2022 dollars. This ensures that the results reflect the growth in wages and output (sales) over the three years since 2019. The adjusted results do not capture the full inflation as witnessed in 2022 but do provide a best approximation of industry impacts.
Fresh Produce and Floral Industries Share of BLS-reported Employment
To conduct a thorough economic analysis, a clear definition of the industry is required. The overall industrial sphere for fresh flowers and produce was analyzed and expanded from previous efforts to provide a more comprehensive view of all the products and services that define today’s industry. This effort resulted in determining a total direct employment. The employment definition provides a complete picture of the scope and scale of industry supply chains using employment figures compiled from a variety of data sources. Employment estimates are full-time equivalent jobs. The Bureau of Labor Statistics (BLS) Quarterly Census of Employment and Wages (QCEW) were used to obtain 2019 base industry employment.
In the North American Industry Classification System (NAICS), the fresh produce and floral supply industry is defined by the NAICS codes.
NAICS Codes that Include Fresh Produce and Floral Supply Industry-relevant Employment
| Wholesale and Retail | |||
|---|---|---|---|
| 42448 | Fruit and vegetable wholesalers | 44523 | Fruit and vegetable markets |
| 42493 | Nursery stock and florists’ supplies wholesalers |
4452 | Retail grocery stores (produce section) |
| Food Service | |||
|---|---|---|---|
| 71 | Arts and entertainment (food service portion) |
72 | Accommodations, food services and restaurants (food service portion) |
| Production | |||
|---|---|---|---|
| 1112 | Arts and entertainment (food service portion) | 1113 | Fruit production (farm) |
| 1114 | Floriculture production and greenhouse nursery (farm) |
115115 | Support for crops (labor contractors/crew leaders) |
After identifying the proper NAICS codes to use as a base, the appropriate portion of each QCEW industry sector to include as industry employment was discerned. Estimated portions were based on secondary data and industry expert estimates. Estimates of self-employment as well as exempted workers (from unemployment insurance) were made using secondary data. In the case of food services, BLS occupational matrices were employed to provide a baseline estimate of food-related workers. Several sources of information were employed to gather data on production workers. Sources include the 2017 US Agricultural Census; USDA Economic Research Service Vegetable and Pulse articles; farm labor articles published by the Wilson Center; National Agricultural Statistical Services (NASS) data found across annual yearbook reports on fruits and vegetables and in USDA Economic Research Articles; and correspondence and interviews carried out with multiple USDA officials. Such sources of information provided estimates of undocumented, and therefore under-counted, workers as well as information regarding the number of workers credited with providing fresh fruits and vegetables.
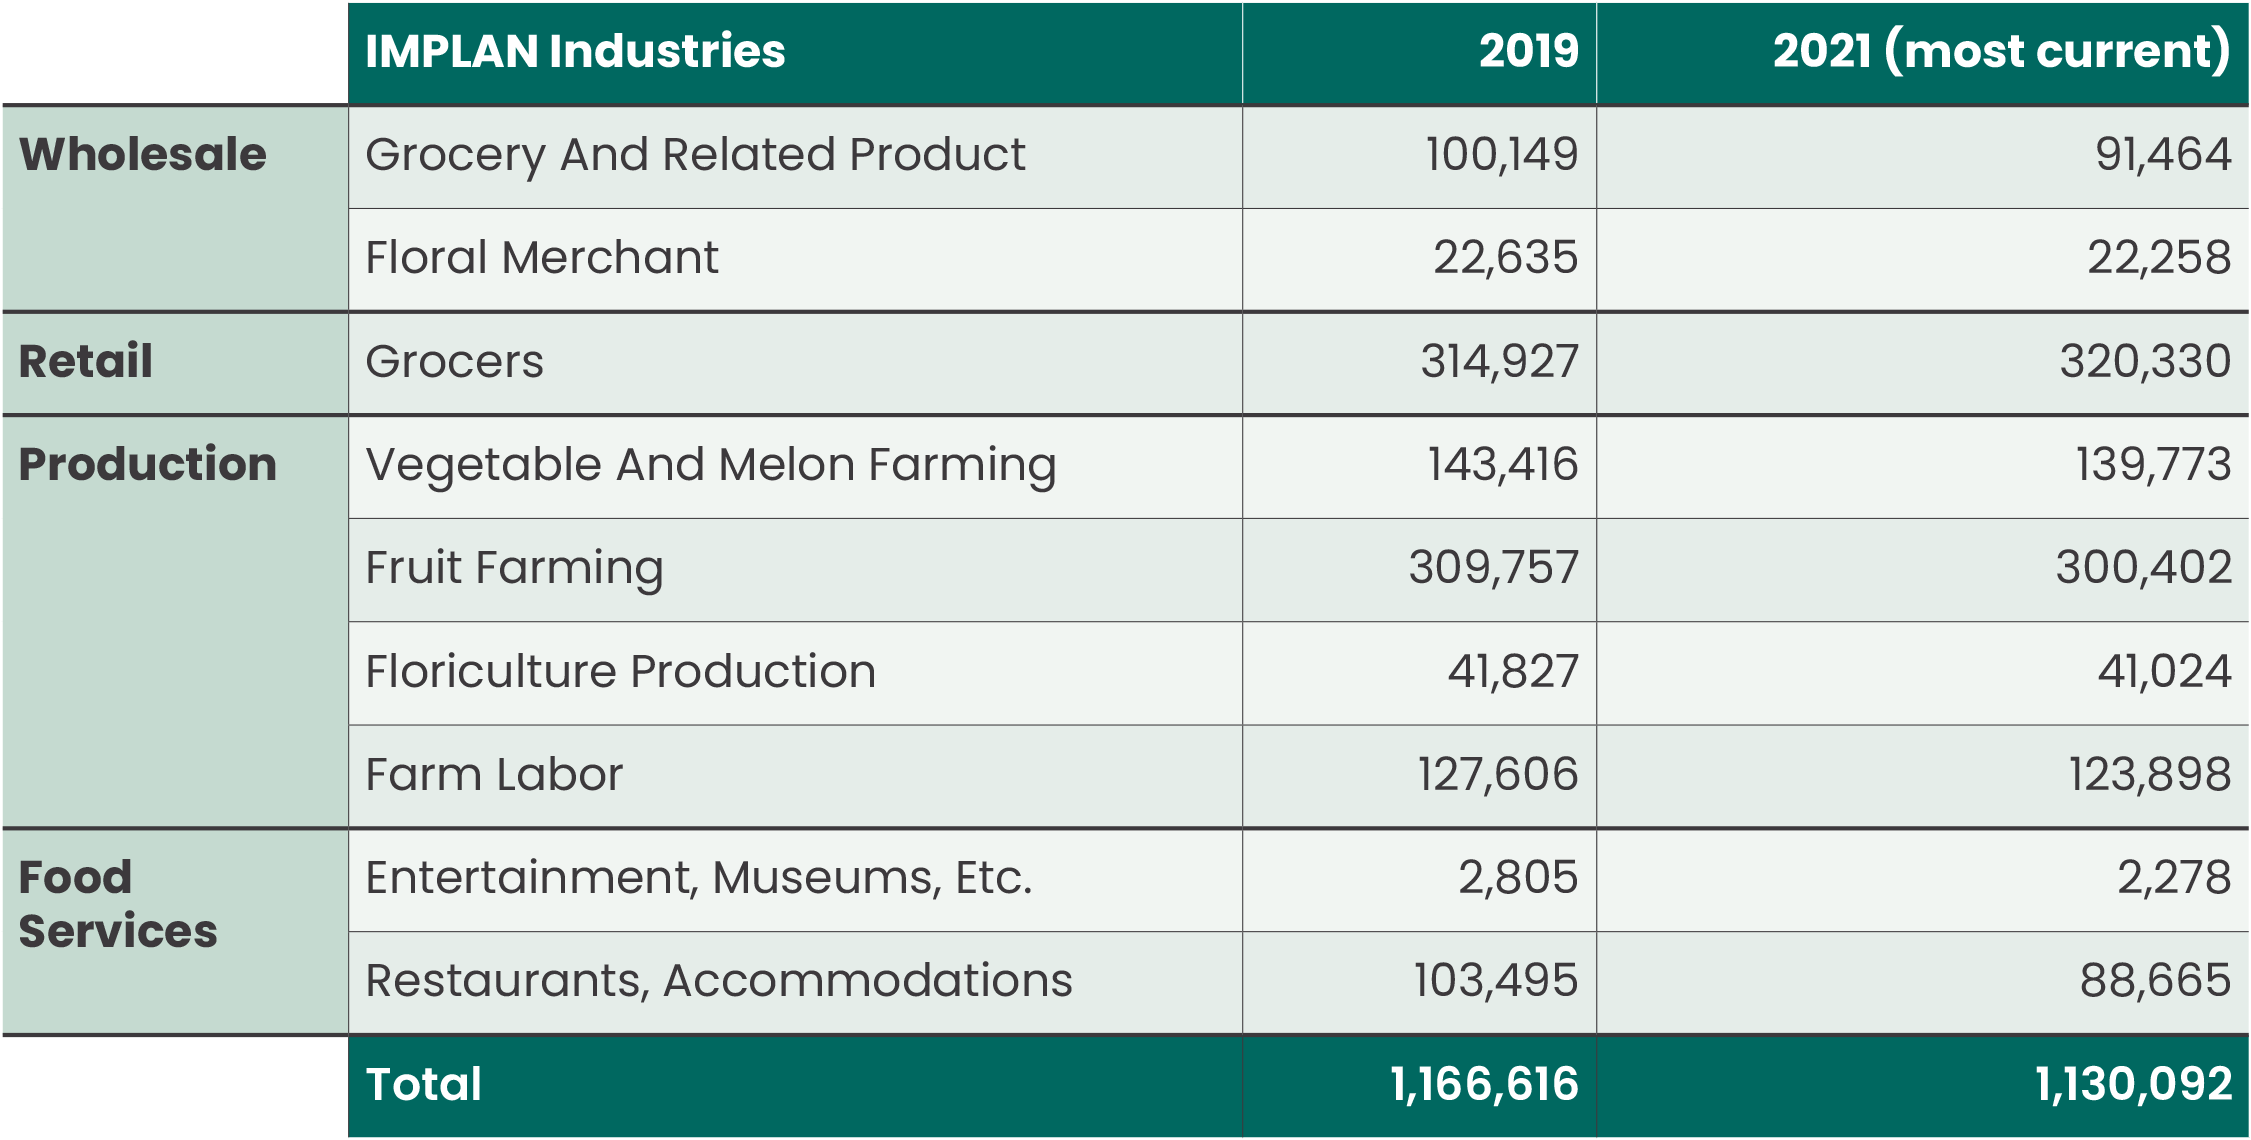
A desegregation of the business lines into sub-sector employment was required to match industry codes used in the IMPLAN model. Production employment, for example, is broken down into four components of Vegetable and Melon Farming, Fruit Farming, Floriculture, and Farm Labor.
Fresh Produce and Floral Supply Employment by IMPLAN Industries
Executive Summary
The U.S. fresh produce and floral industries support jobs in every state and encompass a diverse range of activities and products that extends beyond farmers and producers, including marketing and distribution, retail, and food services.
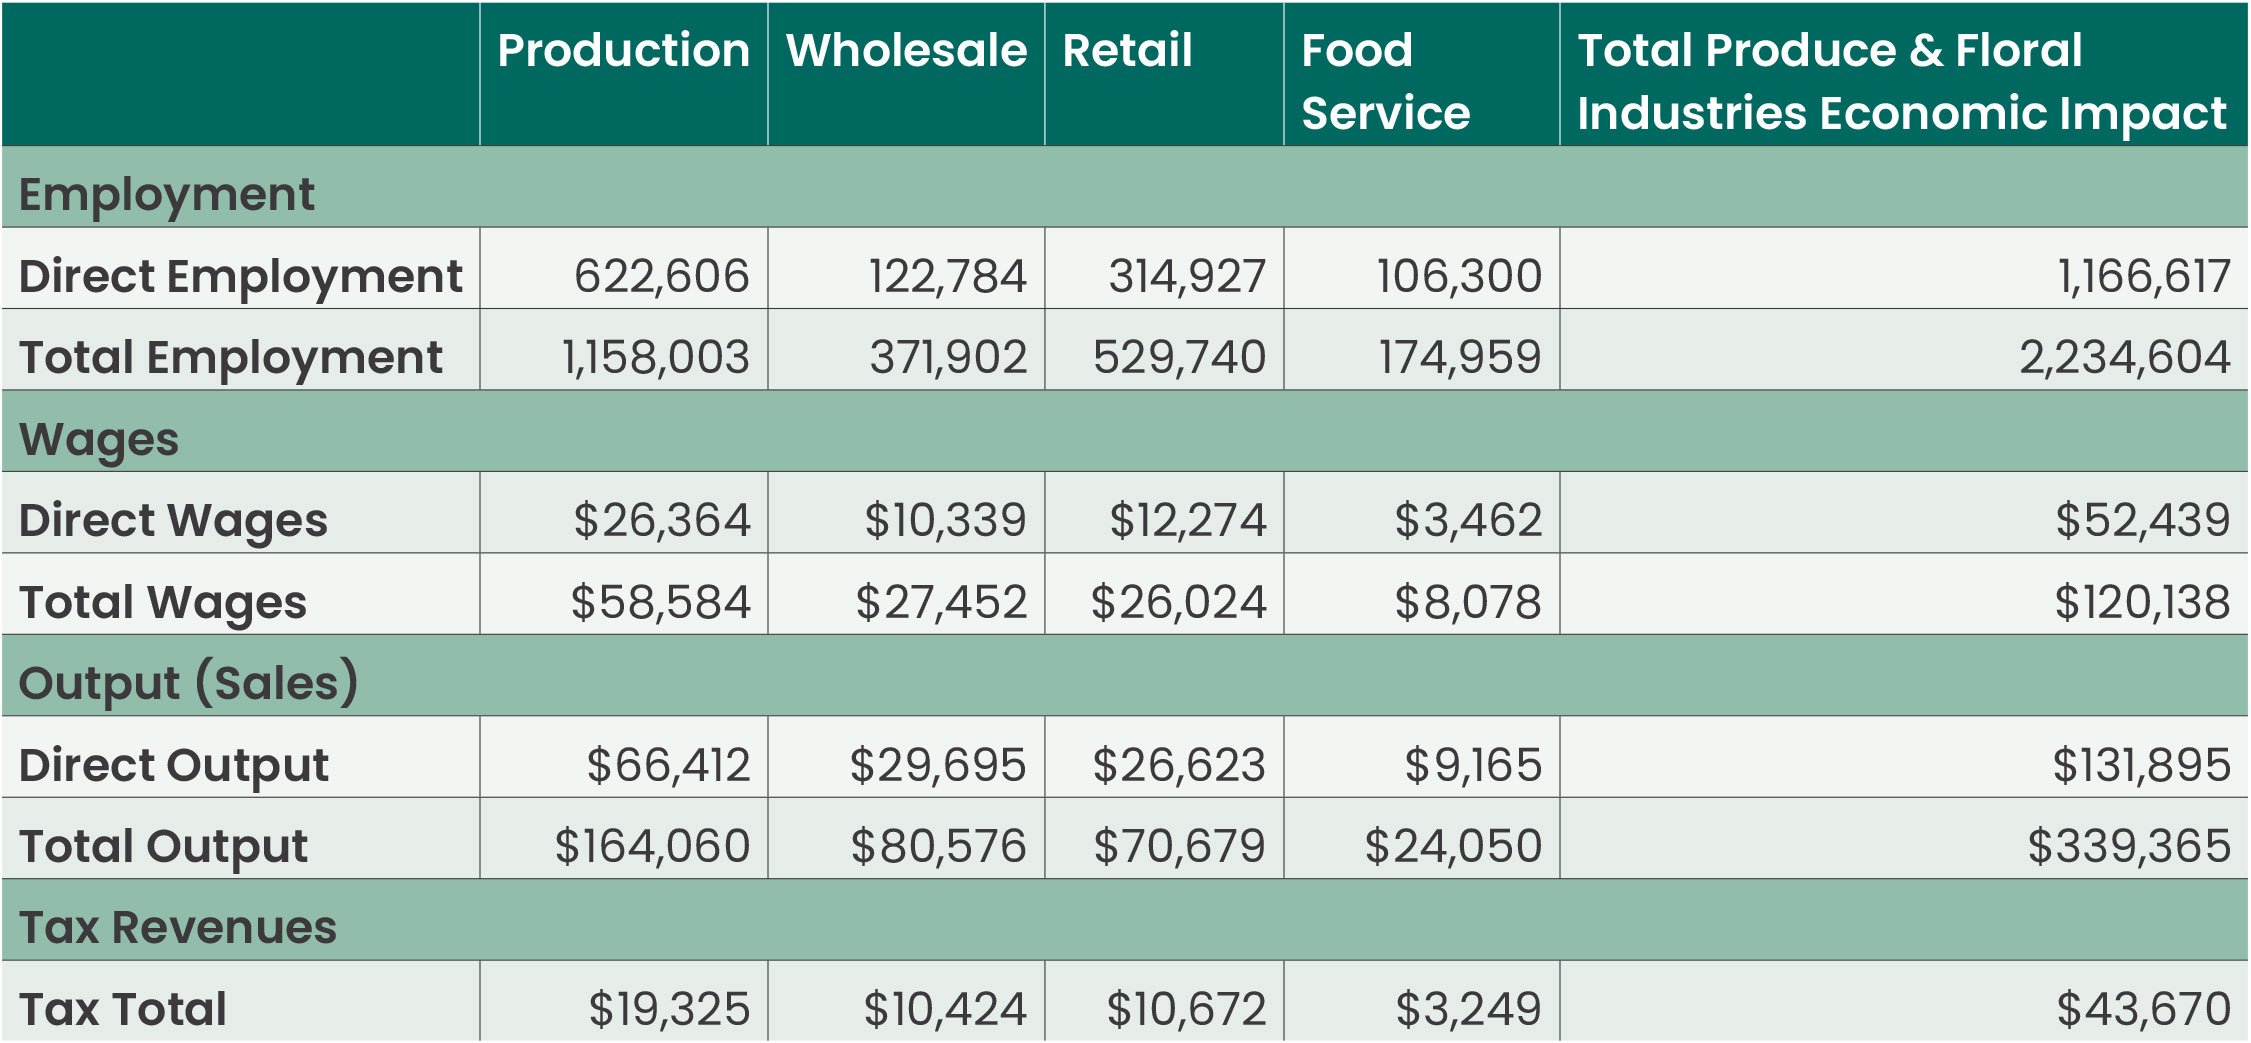
Combining direct and secondary spending, the fresh produce and floral industries’ operations supported 2.2 million full-time and part-time jobs, provided $120.1 billion in labor income (including wages and salaries, benefits, and proprietors’ income), and added $339.4 billion to the national output in 2022. In addition, federal, state, and local taxes generated by the industries, and the spin-off industry sales the activity generates, total $43.7 billion per year.
Nearly 1.2 million jobs are directly tied to the industries’ 2022 operations. The absolute number of employees involved in the fresh produce and floral industries has declined by 4 percent over the past five years – from 1.18 million workers in 2017 to 1.13 million in 2021.
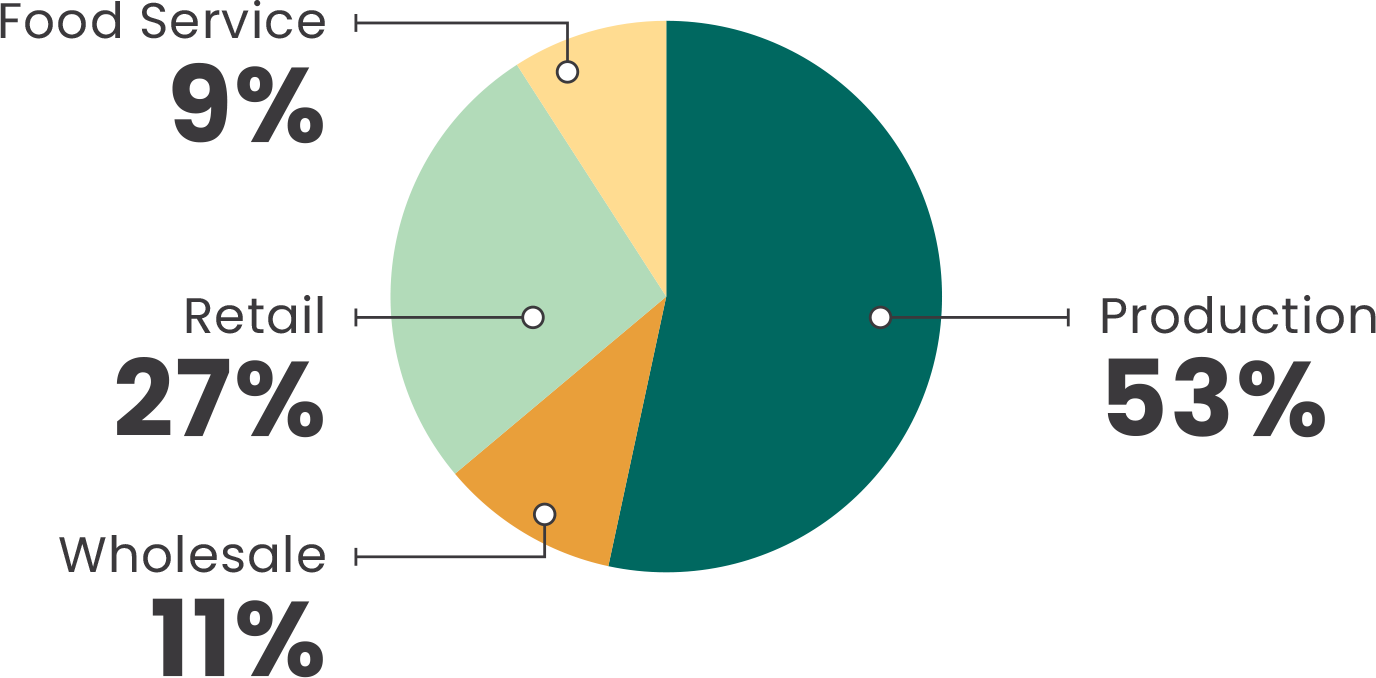
Examining total employment in detail shows over 600,000 jobs, or 54 percent of the industries, are workers in the production sector. Wholesale and retail employment, which includes a variety of fresh fruit and floral operations, reached 434,000 and accounts for 38 percent of the industries. The smallest employment within the industries is the food service sector.
The portion of the fresh produce and floral industries represented by floral firms accounts for 92,176 direct jobs, or 8 percent within the industry, and generates an additional 117,093 indirect and induced jobs for a total economy-wide job count of 209,269. Due to industry employment and its economic impacts, total wages amount to $12.5 billion per year on economy-wide sales of $38.2 billion. Of the $38.2 billion, $14.9 billion are floral industry direct sales.
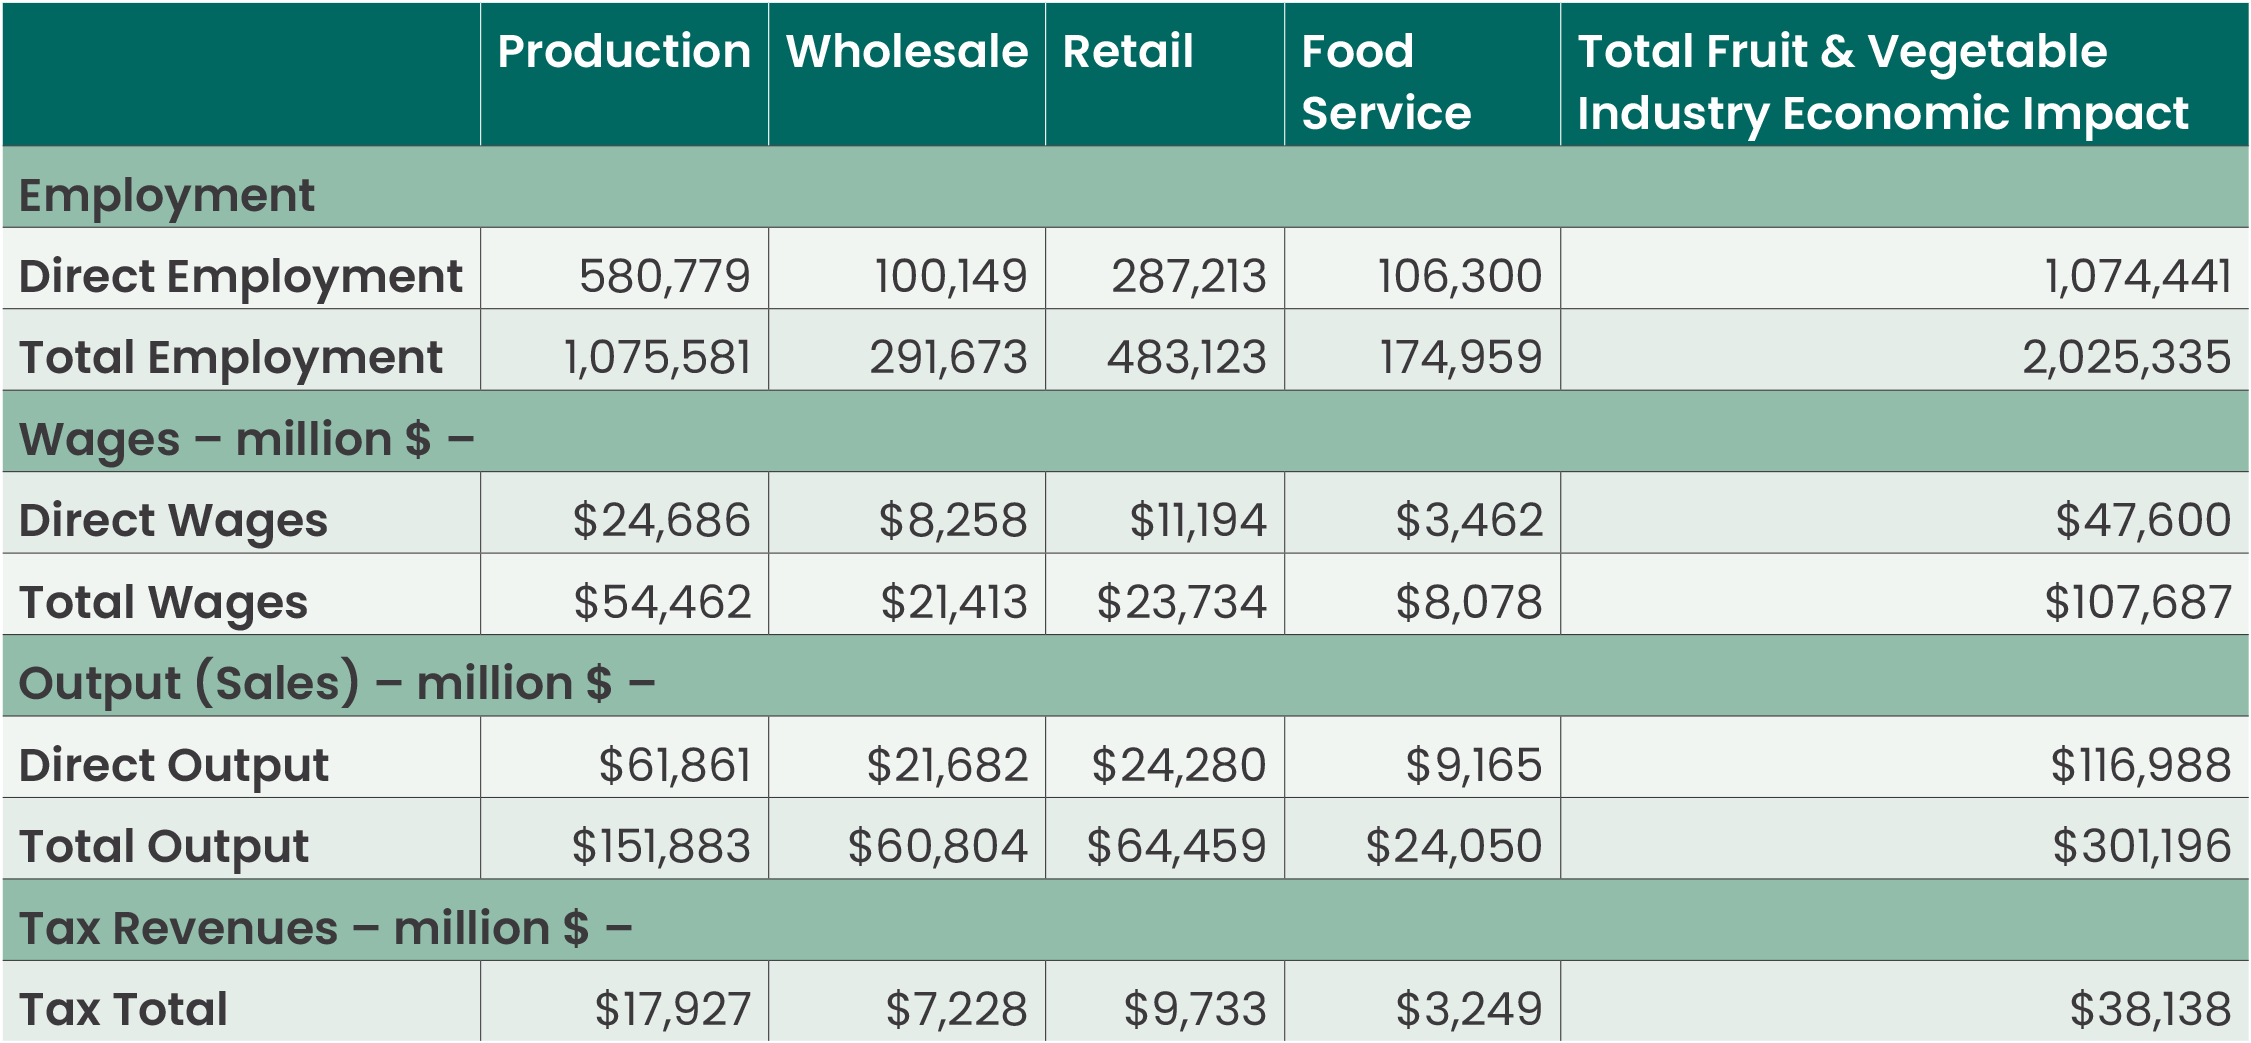
The largest employer of the fresh produce and floral industries is the fruit and vegetable sector with 1,074,441 workers or 92 percent of the industry employment. Counting the direct, indirect, and induced impacts, the fruits and vegetable sector’s total employment impact on the national economy in 2022 amounted to 2,025,335 full-time and part-time jobs and accounted for $301.2 billion in annual sales and total wages of $107.7 billion.
The industries’ economic impact reaches all 50 states and the District of Columbia. The impact varies from state to state, depending on factors such as each state’s industry mix, wage structure, spending and saving patterns, and connections to other economies. Twenty-nine states have more than 10,000 jobs attributable to the industry; only ten states have less than 4,000.
Fresh Produce & Floral Industries
Seasonality
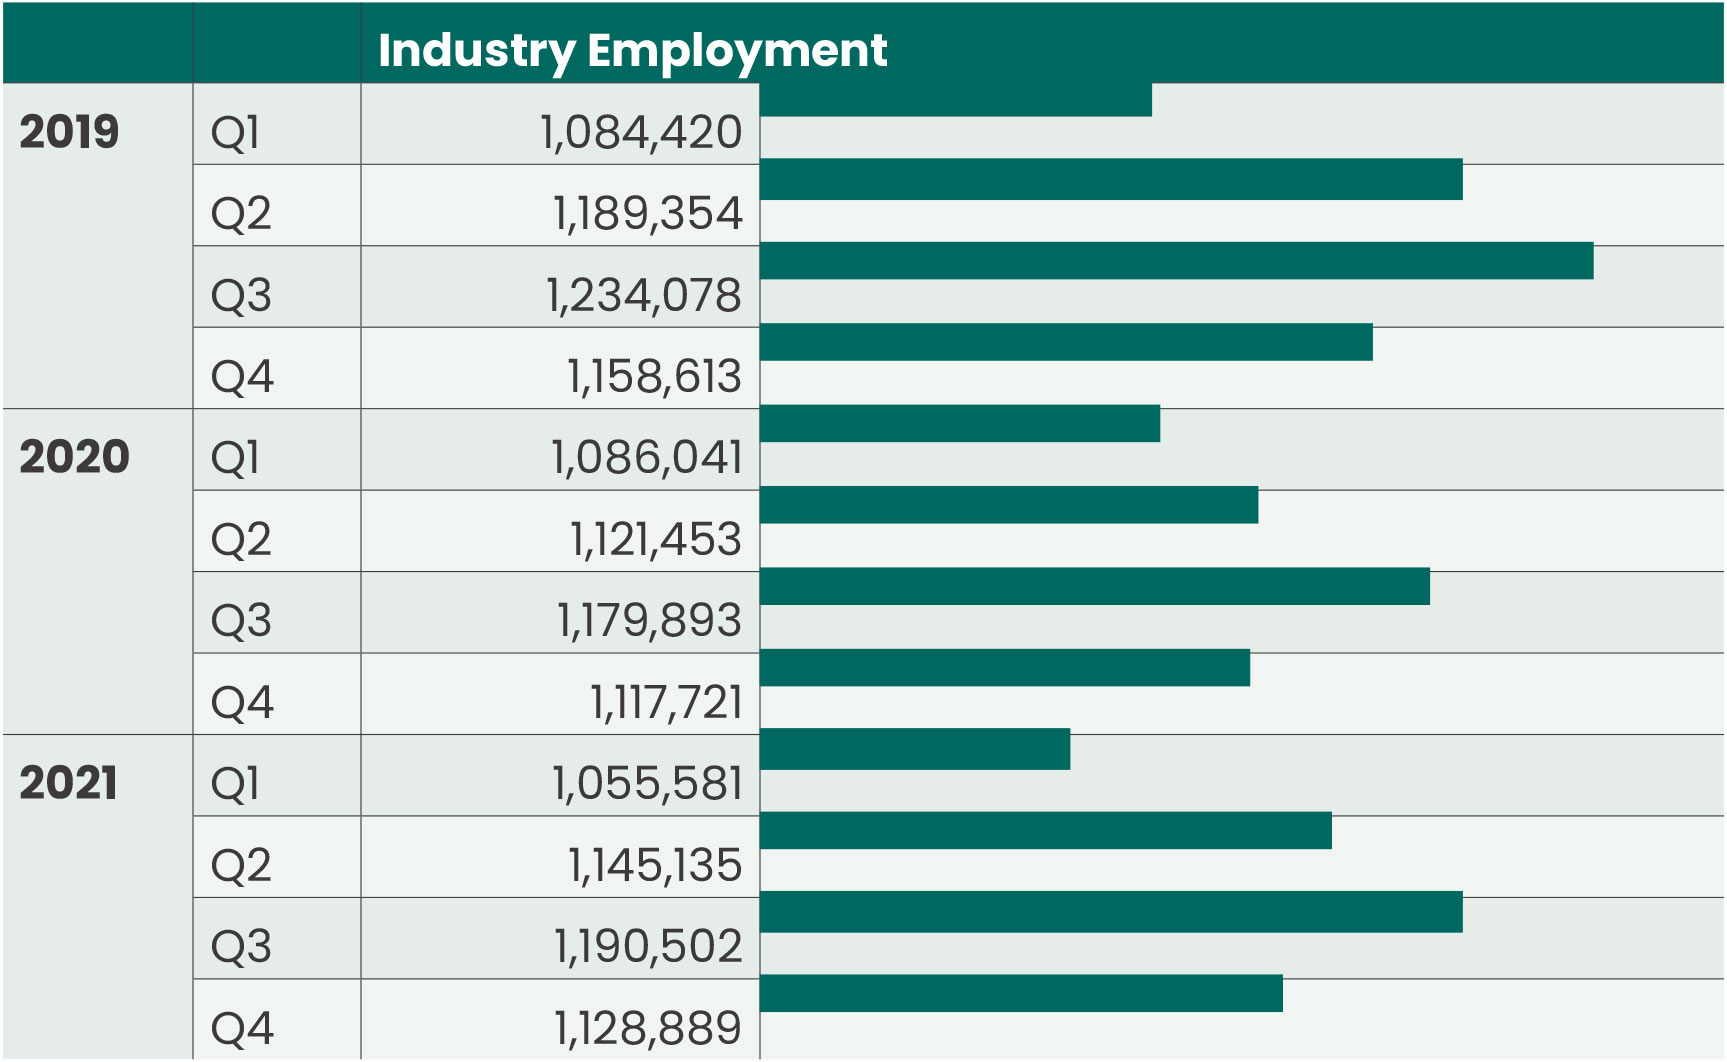
During the fourth quarter of 2021, industry employment totaled 1.1 million people. There is notable seasonality to total industry employment by about 10 percent during the peak third quarter of the year. However, the annual employment average has remained relatively consistent since 2019, fluctuating between 1.1 million and 1.2 million workers.
Fresh Produce and Floral Industries Employment by Quarter, 2019-2021
Employment by Business Sector
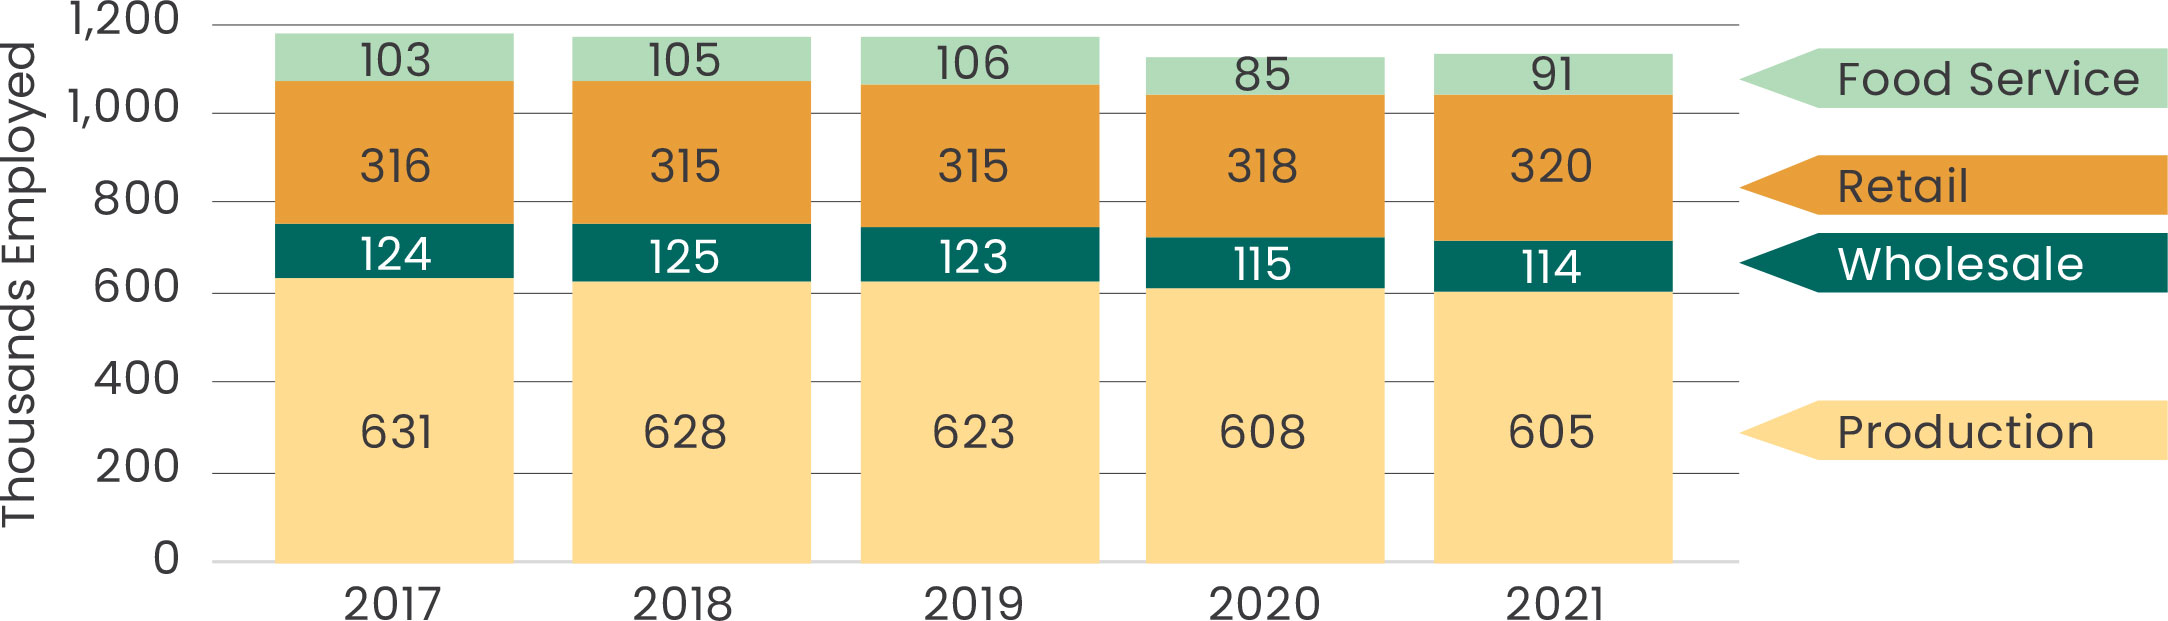
When segmented along business sectors, production firms employ the most workers. 605,000 employees, or 54 percent of all employees, were employed on farms growing fruits, vegetables, and flowers in 2021. There is a minimal decline in jobs between 2017 and 2021, with perhaps the exception of the food service business sector. Food service went from employing 103,000 industry workers in 2017 to employing only 91,000 workers in 2021, a 12.0 percent reduction in jobs for that business line.
Fresh Produce and Floral Industries Employment by Business Sector, 2017 – 2021
This provides an industry comparison as to the relative magnitude of employment within the fresh produce and floral supply industries versus select 4-digit food production and manufacturing industries.
Comparative Magnitude of Direct Employment, 2019
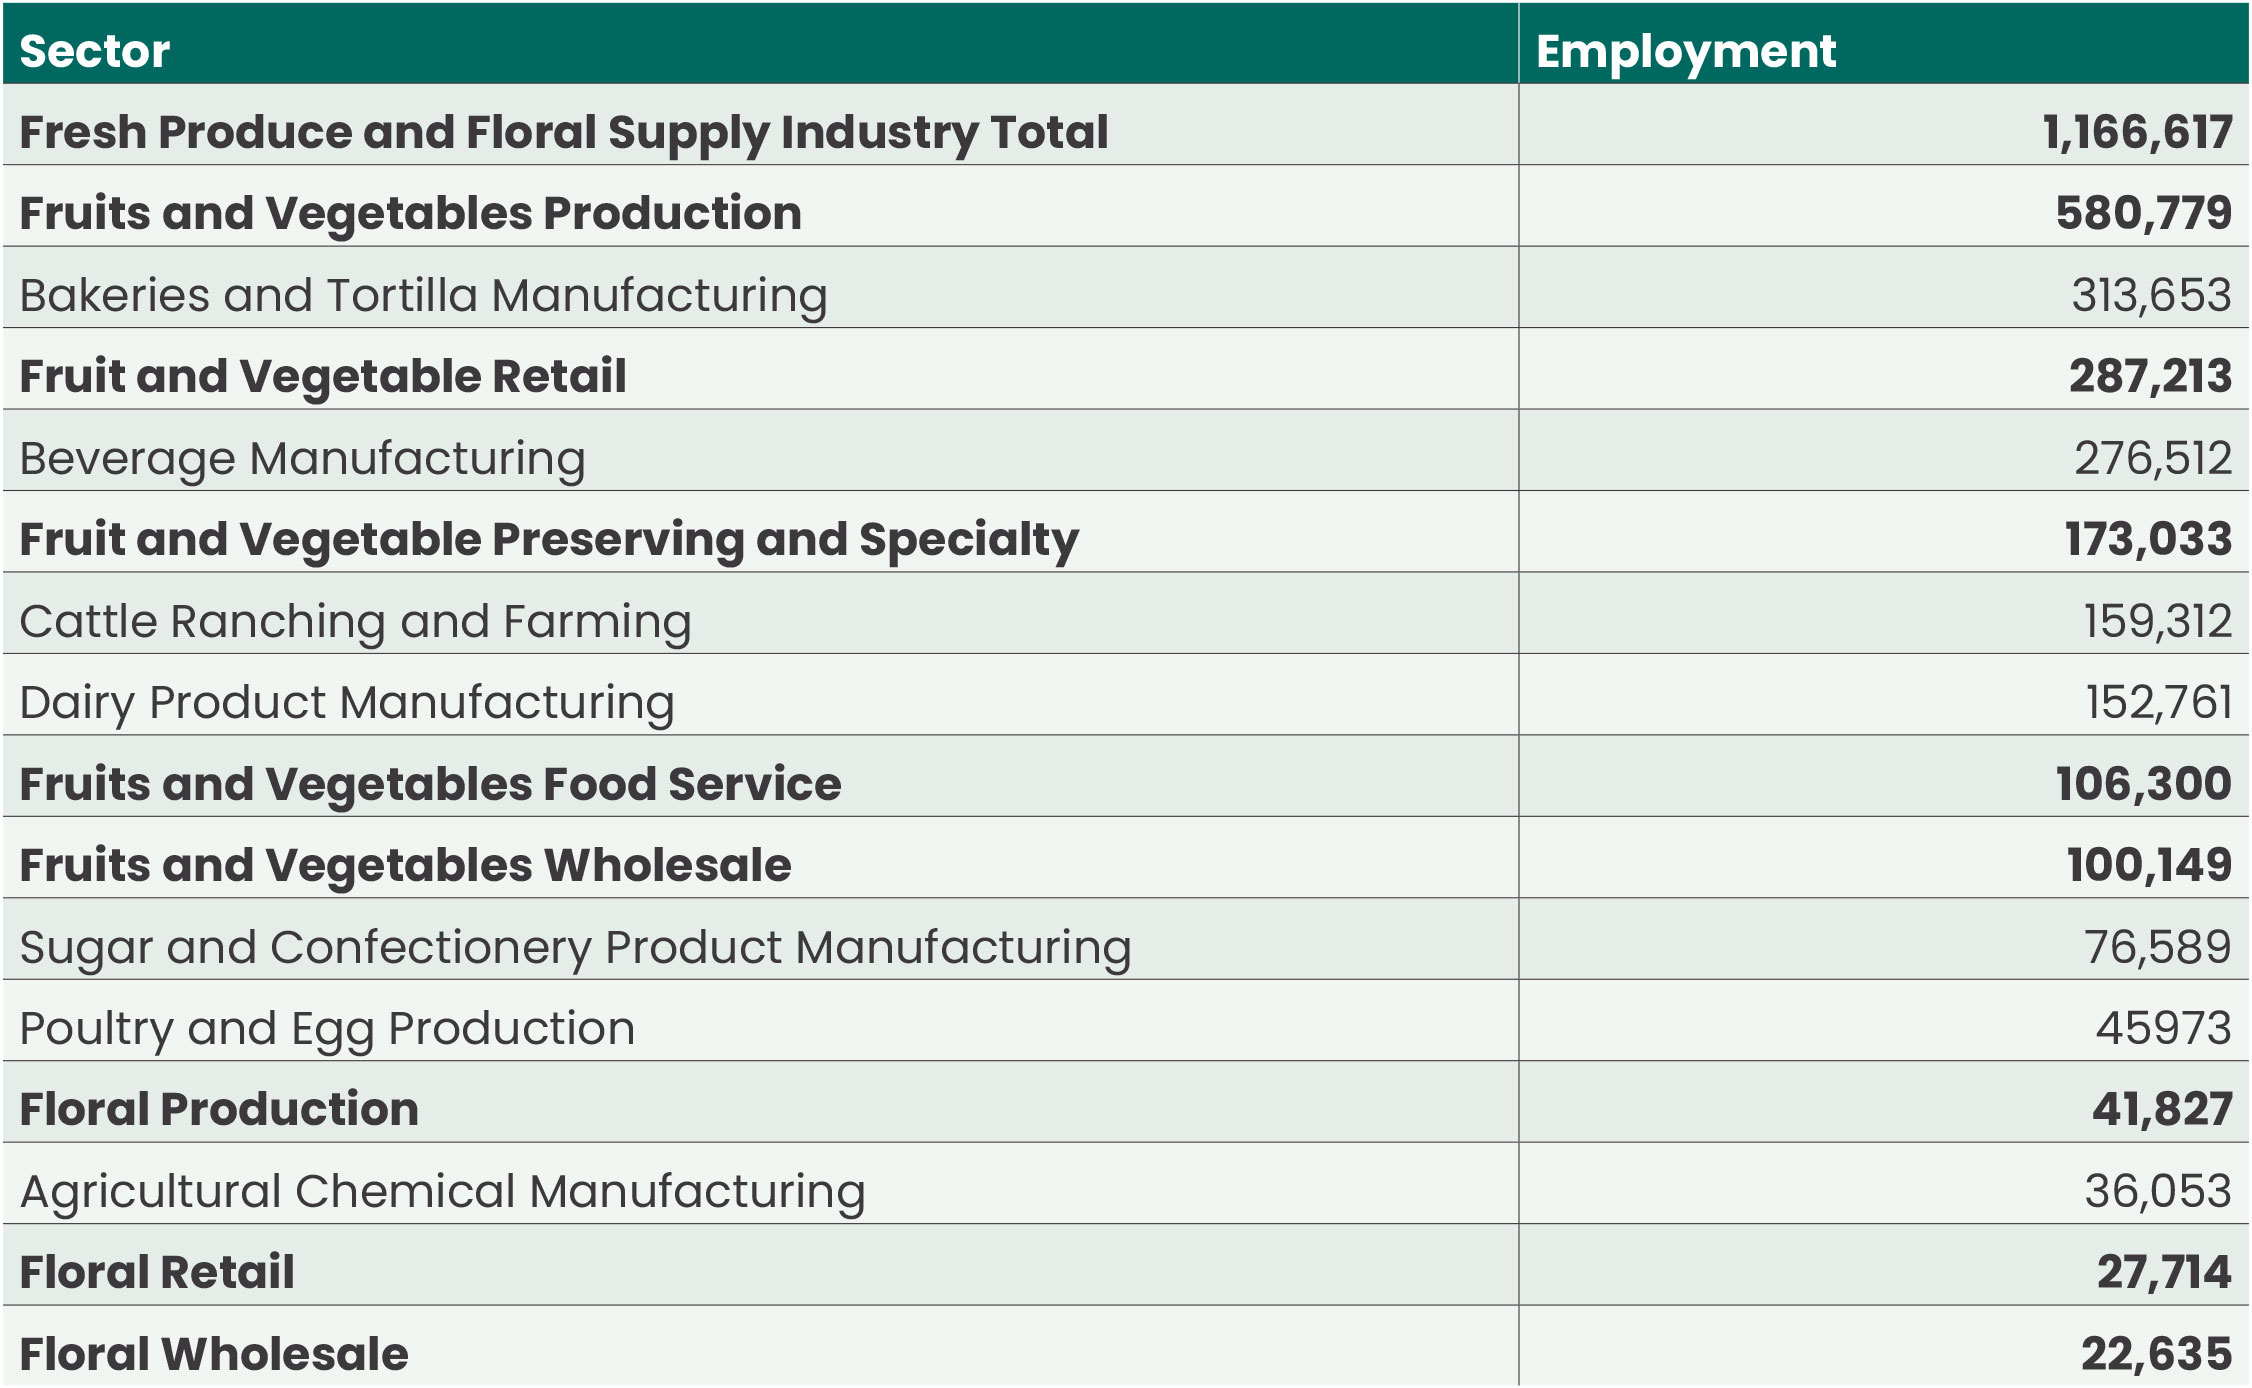
Source: Bureau of Labor Statistics, Quarterly Census of Employment and Wages (QCEW)
National Economic Impact
The total economic impact measured includes:
THE DIRECT IMPACT
(the jobs, labor income, and output within the U.S. fresh produce and floral industries)
THE INDIRECT IMPACT
(the jobs, labor income, and output occurring in other industries due to the fresh produce and floral supply industries’ purchases of inputs)
THE INDUCED IMPACT
(the jobs, labor income, and output resulting from household spending of income earned either directly or indirectly from the industries’ economic activities)
In this analysis, the change of output, jobs, and wage income is determined by the change in employment required to meet the final demand for the fresh produce and floral supply industries businesses. (See Appendix for more details)
Kleinhenz & Associates estimates that at the national level, combining all spending, the operations of the fresh produce and floral industries supported 2.2 million full-time and part-time jobs, provided $120.1 billion in labor income (including wages and salaries, benefits, and proprietors’ income), and added $339 billion to the national output in 2022. The $339 billion reflects the impact of direct sales of the U.S. fresh produce and floral industries, the economic impact of suppliers that support the food and agriculture industries, as well as that of downstream industries that are supported by the spending of those directly employed by the fresh produce and floral industry and by those employed by firms dependent on those industries.
In addition, federal, state, and local taxes generated by the industries, and the spin-off industry sales their activity generates, total $43.7 billion per year.
The produce & floral industries added $339 billion to the national output in 2022.
Fresh Produce and Floral Supply Industry Economic Impact by Business Line, 2019 (2022$)
Wages and output are in millions of dollars
U.S. Fresh Produce and Floral Industries Employment Shares by Business Sector, 2019
Fruit and Vegetable Industry
Counting the direct, indirect, and induced impacts, the fruits and vegetable industry total employment impact on the national economy in 2022 amounted to 2,025,335 full-time and part-time jobs, and accounted for $301.2 billion in annual sales. The estimated direct employment of fruit and vegetable production firms within the industry is 580,779 jobs. By including indirect and induced effects, the production sector generates further impacts of 494,802 jobs for a total economy-wide job impact of 1,075,581 jobs that earn $54.5 billion in wages per year. Federal, state, and local taxes generated by the fresh produce and floral supply industry, and the spin off industry sales its activity generates, total $38.1 billion per year.
Fruits and Vegetables Industry Economic Impact by Business Sector, 2019 (2022$)
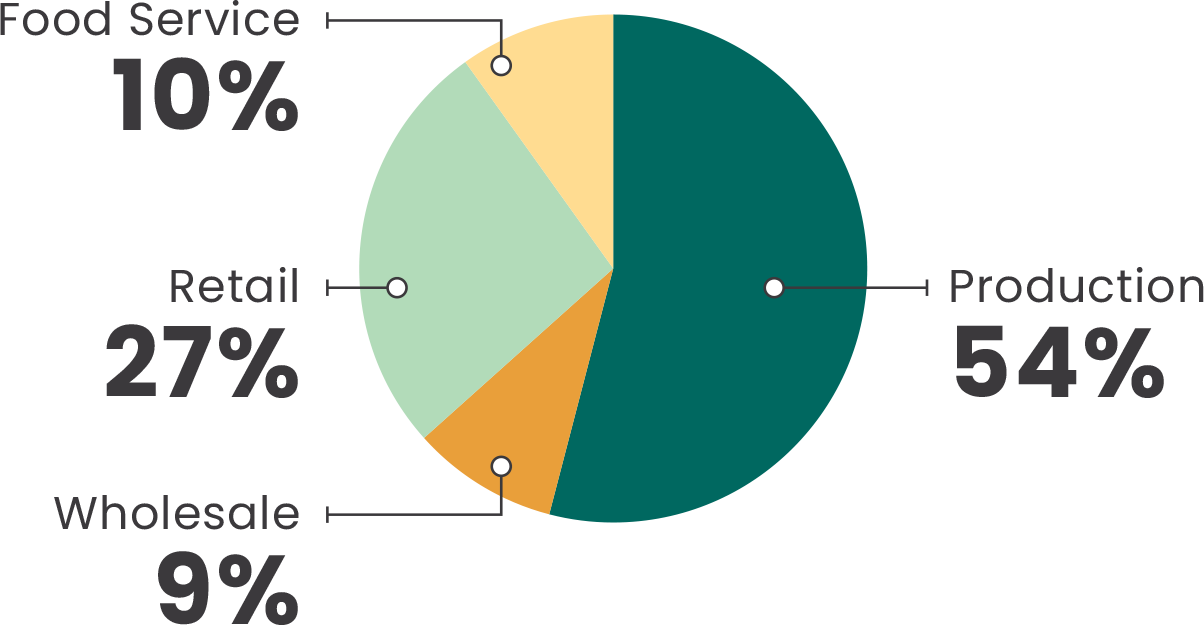
U.S. Fruits and Vegetables Employment Shares by Business Sector, 2019
The Floral Industry
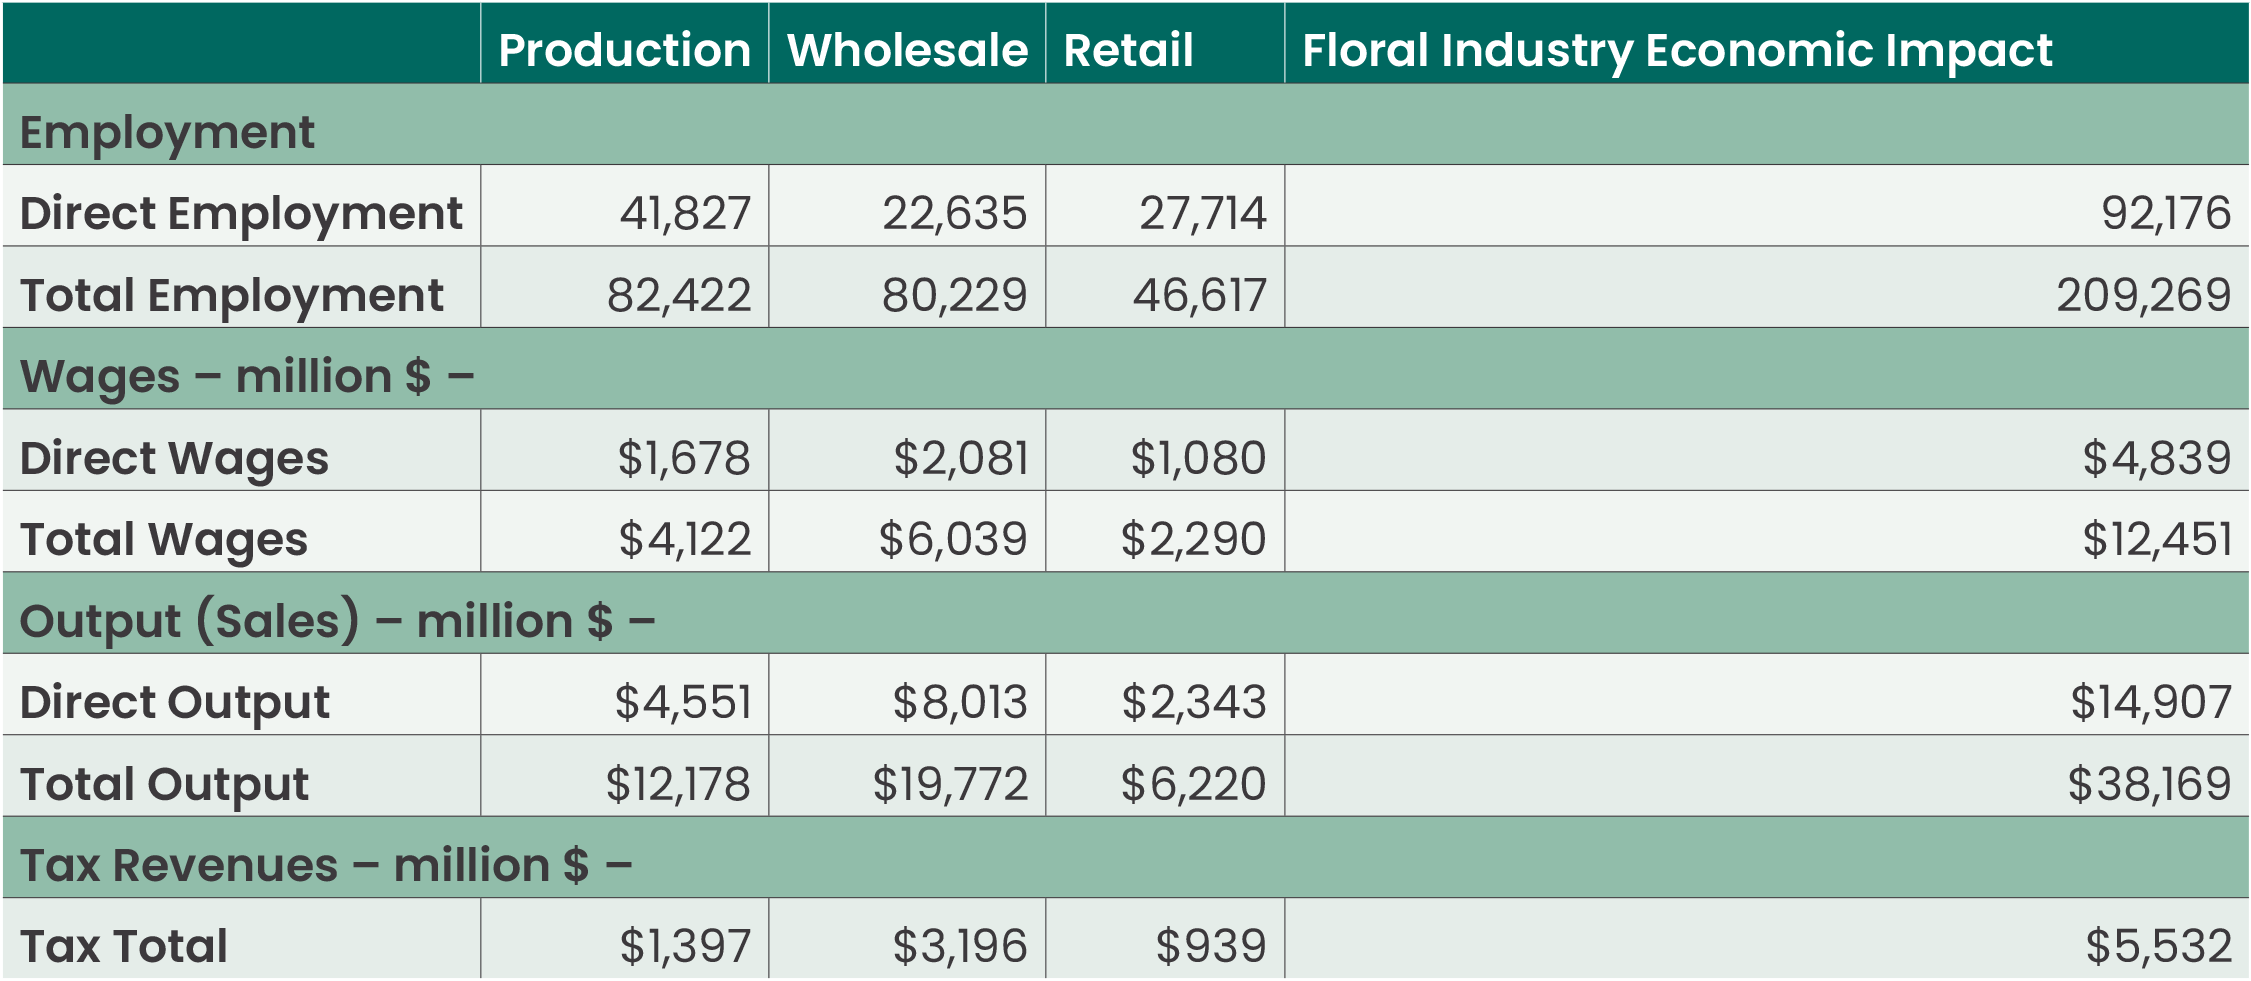
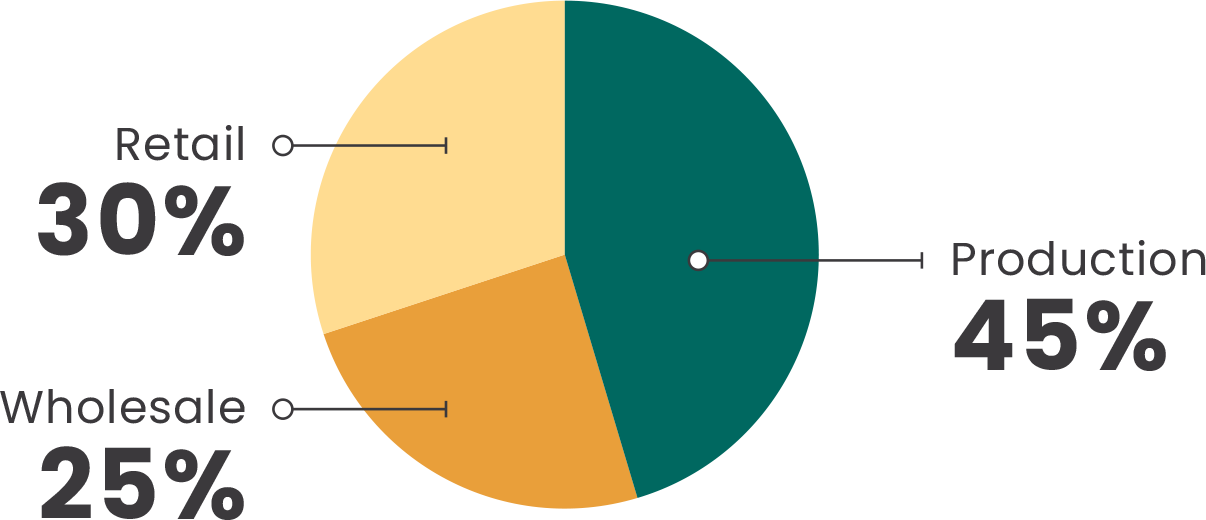
The Floral Industry accounts for 92,176 direct jobs within the industry and an additional 117,093 indirect and induced jobs to generate a total economy-wide job count of 209,269. Production of flowers requires 41,827 direct jobs and generates 82,422 jobs economy-wide. Within the floral supply sub-sector, direct production accounts for 45 percent of jobs, direct wholesale accounts for 25 percent of jobs, and direct retail accounts for 30 percent of jobs.
Due to industry employment and its economic impacts, total wages amount to $12.5 billion per year on economy-wide sales of $38.2 billion. Of the $38.2 billion, $14.9 billion are floral industry direct sales. Federal, state, and local taxes generated by the industry, and the spin off industry sales its activity generates, total $5.5 billion per year.
Floral Supply Industry Economic Impact by Business Sector, 2019 (2022$)
U.S. Floral Employment Shares by Business Sector, 2019
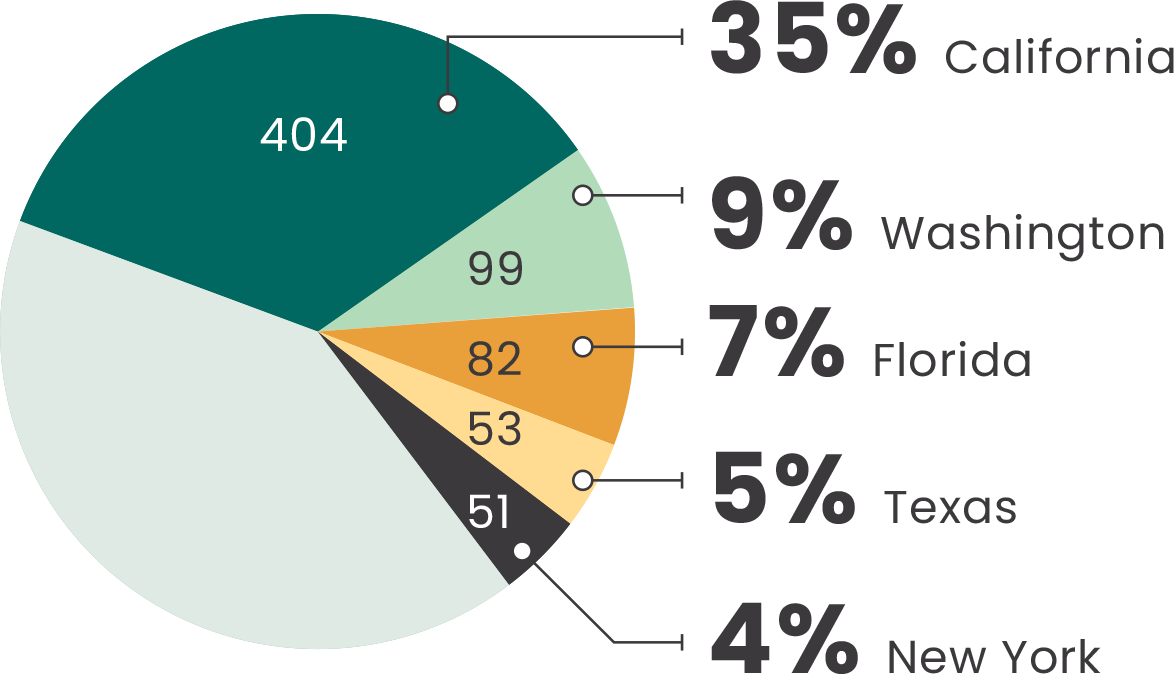
California holds the highest concentration of fresh produce and floral employment, representing 35% of the industry employment.
By State
The industries’ economic impact reaches all 50 states and the District of Columbia. The impact varies from state to state, depending on factors such as each state’s industry mix, wage structure, spending and saving patterns, and connections to other economies. The state-level impact presented below reflects the industries’ operational impacts.
Twenty-nine states have more than 10,000 jobs attributable to the industry; only ten states have less than 4,000.
The state of California holds the highest concentration of fresh produce and floral employment at 404,468 employees, representing 35 percent of the industries employment nationwide. Washington and Florida are distant second and third with 99,320 and 82,013 industry employees. The top five states are home to 59 percent of all industry employees.
Distribution of Fresh Produce and Floral Supply Industry Employment by State (in thousands)
![]()
The fresh produce & floral industries
support more jobs than most sectors
of perishables including cattle ranching
& farming, dairy manufacturing, and
poultry & egg production.
Fresh Produce and Floral Supply Industry Economic Impact by State, 2019 (2022$)
| Direct Employment |
Total Employment |
Direct Output |
Total Output |
||
|---|---|---|---|---|---|
| 1 | California | 404,468 | 676,332 | $50,649,754,732 | $96,936,790,632 |
| 2 | Washington | 99,320 | 145,247 | $9,365,657,846 | $16,677,799,898 |
| 3 | Florida | 82,013 | 169,196 | $10,237,910,147 | $25,209,083,585 |
| 4 | Texas | 52,944 | 87,679 | $5,591,004,064 | $11,435,832,733 |
| 5 | New York | 50,802 | 69,356 | $4,860,533,240 | $8,595,850,555 |
| 6 | Oregon | 34,162 | 50,310 | $2,957,970,540 | $5,313,301,896 |
| 7 | Pennsylvania | 30,549 | 47,738 | $2,934,871,172 | $5,798,804,547 |
| 8 | Georgia | 24,899 | 44,422 | $3,102,159,191 | $6,120,061,040 |
| 9 | Michigan | 28,678 | 43,648 | $2,529,674,292 | $4,831,881,731 |
| 10 | Arizona | 23,388 | 42,945 | $3,009,350,777 | $6,038,802,834 |
| 11 | New Jersey | 26,871 | 41,444 | $2,999,094,804 | $5,606,326,883 |
| 12 | Illinois | 23,694 | 38,583 | $2,707,140,937 | $5,439,381,152 |
| 13 | North Carlina | 21,538 | 36,635 | $2,307,576,557 | $4,650,015,945 |
| 14 | Ohio | 21,687 | 33,116 | $1,900,692,147 | $3,788,068,969 |
| 15 | Massachusetts | 20,279 | 29,629 | $1,859,094,177 | $3,599,713,667 |
| 16 | Colorado | 12,756 | 21,602 | $1,454,862,031 | $2,896,824,542 |
| 17 | Wisconsin | 14,670 | 21,423 | $1,283,412,371 | $2,345,972,567 |
| 18 | Virginia | 15,200 | 21,387 | $1,277,710,993 | $2,334,175,092 |
| 19 | Maryland | 12,836 | 19,830 | $1,488,095,019 | $2,726,588,888 |
| 20 | Idaho | 10,523 | 19,170 | $1,610,167,554 | $2,812,554,736 |
| 21 | Minnesota | 11,469 | 19,028 | $1,376,561,653 | $2,702,286,277 |
| 22 | Tennessee | 10,558 | 16,417 | $1,049,592,928 | $2,015,149,429 |
| 23 | South Carolina | 10,083 | 15,343 | $957,561,273 | $1,705,346,256 |
| 24 | Indiana | 9,570 | 14,206 | $864,530,003 | $1,610,206,811 |
| 25 | Missouri | 8,734 | 13,268 | $802,451,145 | $1,540,738,806 |
| 26 | Hawaii | 8,121 | 11,050 | $619,649,034 | $1,089,637,631 |
| 27 | Connecticut | 7,430 | 10,691 | $751,690,601 | $1,365,408,625 |
| 28 | Kentucky | 6,777 | 10,264 | $671,999,331 | $1,211,916,847 |
| 29 | Louisiana | 6,792 | 10,087 | $664,456,919 | $1,174,977,421 |
| 30 | Iowa | 6,735 | 9,883 | $685,848,325 | $1,197,443,600 |
| 31 | Nevada | 6,258 | 9,720 | $773,311,986 | $1,350,925,379 |
| 32 | Alabama | 6,202 | 9,018 | $555,761,148 | $982,503,450 |
| 33 | New Mexico | 6,352 | 8,394 | $497,409,874 | $792,056,841 |
| 34 | Utah | 5,201 | 8,116 | $504,515,965 | $969,586,232 |
| 35 | Maine | 5,486 | 8,076 | $438,977,500 | $789,397,705 |
| 36 | Oklahoma | 4,123 | 6,342 | $411,193,038 | $759,359,163 |
| 37 | Kansas | 4,141 | 6,019 | $410,133,042 | $724,293,993 |
| 38 | Mississippi | 3,826 | 5,528 | $343,439,231 | $587,256,659 |
| 39 | Nebraska | 3,449 | 5,361 | $353,992,548 | $631,804,872 |
| 40 | New Hampshire | 4,010 | 5,361 | $288,233,068 | $519,722,752 |
| 41 | Arkansas | 3,394 | 4,881 | $310,484,477 | $538,589,065 |
| 42 | Rhode Island | 2,269 | 3,288 | $212,582,427 | $381,351,348 |
| 43 | West Virginia | 2,556 | 3,218 | $173,283,989 | $270,532,860 |
| 44 | North Dakota | 2,108 | 3,141 | $267,730,151 | $441,661,454 |
| 45 | Vermont | 2,237 | 3,123 | $197,946,267 | $329,504,531 |
| 46 | Delaware | 1,831 | 2,715 | $179,750,508 | $325,131,410 |
| 47 | Montana | 1,660 | 2,367 | $132,279,820 | $238,402,004 |
| 48 | South Dakota | 1,260 | 1,684 | $100,220,057 | $169,772,701 |
| 49 | District of Columbia | 1,193 | 1,379 | $116,295,262 | $158,499,077 |
| 50 | Alaska | 788 | 1,031 | $61,523,400 | $102,632,149 |
| 51 | Wyoming | 731 | 923 | $57,267,274 | $87,951,478 |
Appendix
Use of IMPLAN
IMPLAN provides a highly accurate and adaptable model for its users. The IMPLAN database contains county, state, and federal economic statistics, which are specialized by region. IMPLAN accounts closely follow the account - ing conventions used in the “Input-Output Study of the U.S. Economy” by the U.S. Bureau of Economic Analysis.
The IMPLAN model uses input-output accounting that describes commodity flows from producers to intermediate and final consumers. The total industry purchases of commodities, services, employment compensation, value added, and imports are equal to the value of the commodities produced. Purchases for final use (final demand) drive the model. Industries produce goods and services for final demand and purchase goods and services from other producers. These other producers, in turn, purchase goods and services. This buying of goods and services (indirect purchases) continues until leak - ages from the region (imports and value added) stop the cycle. These indirect and induced effects (the effects of household spending) can be mathemat - ically derived. The resulting sets of multipliers describe the change of output for each and every regional industry caused by a one dollar change in final demand for any given industry.
In this analysis, the change of output, jobs, and wage income is determined by the change in employment required to meet the final demand for the fresh produce and floral supply industry businesses. A multi-regional I-O model was created for each of the 50 states, plus the District of Columbia, using the 2019 model data (multipliers). Industry employment levels for each of nine IMPLAN sectors were entered into the model as stimulus. Trade benefits are captured between the selected state and the other 50 regions.
While the employment and multipliers reflect the 2019 economy, the wages and sales figures are stated in 2022 dollars using the IMPLAN price adjust - ment factors. By default, economic impacts are reported in model year dollars (2019) and it is handy to be able to report the results in current year dollars (2022). The BLS produces time-series of output estimates for its Em - ployment Growth Model. These outputs are projected in real and nominal dollars and these projections are the basis for estimates of IMPLAN price adjustment indexes. The output inflators are specific to each industry and are applied automatically to the IMPLAN estimates generated by the 2019 base model. IMPLAN provides output by industry as well as final demand estimates for the years 2019 through 2021. Although results for this report are presented in 2022 these estimates do not capture the full inflation wit - nessed in 2022 but serve to approximate the current size the fresh produce and floral supply industry benefits.
More About the Economic Impact of U.S. Food and Ag Industries
A number of organizations, including International Fresh Produce Association, sponsored the 2024 Feeding the Economy report. America's food and agriculture sector directly support nearly 24 million jobs, accounting for over 15% of U.S. employment.
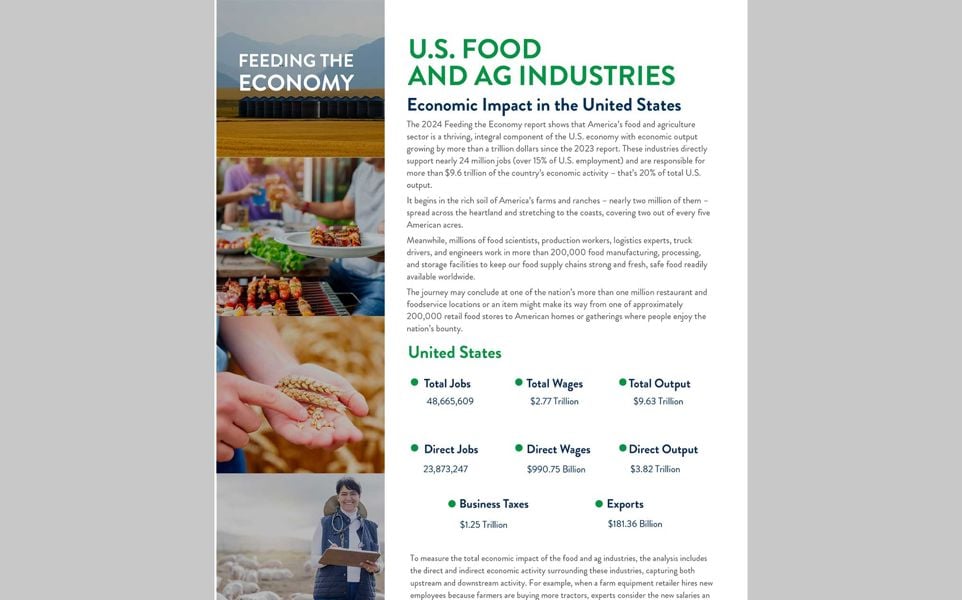
Feeding the Economy
The 2024 Feeding the Economy report, sponsored in part by IFPA, shows how America's food and ag sector is a thriving and integral part of the U.S. economy.
Learn More